


Your marketing budget is growing, your sales team is closing deals, and new customers are coming through the door – but are you actually making money? The answer lives in a single metric that separates profitable growth from expensive churn: customer acquisition cost. Most businesses track CAC inconsistently or calculate it incorrectly, which means they’re making budget decisions based on incomplete data. For eCommerce and SaaS operators in Central and Eastern Europe, where cost structures differ meaningfully from Western benchmarks, precision in this calculation isn’t academic – it’s the difference between scaling profitably and burning cash while competitors gain ground.
Customer acquisition cost (CAC) is the total spend required to convert a prospect into a paying customer. Calculated by dividing total sales and marketing costs by new customers acquired, it is the foundational metric for evaluating growth efficiency. In CEE markets, digital advertising costs run 30–50% below Western European equivalents, creating a structural advantage for businesses that measure and optimize CAC with precision. The widely accepted benchmark for sustainable acquisition economics is an LTV to CAC ratio of at least 3:1.
Table of Contents
- What are customer acquisition costs and why they matter
- CAC formula and how to calculate acquisition cost per customer
- Average CAC benchmarks across industries and business models
- Customer acquisition cost benchmarks for CEE markets
- CAC metrics and performance indicators to track
- Proven strategies to reduce acquisition cost per customer
- Frequently Asked Questions
What are customer acquisition costs and why they matter
Customer acquisition cost (CAC) is the total amount your business spends to bring in a single new customer. It captures every dollar invested across marketing campaigns, sales activities, tools, and supporting operations – all in service of converting a prospect into a paying customer. Far from being just another line item, CAC is one of the most revealing indicators of how efficiently your growth engine is running.
Understanding this metric matters because it sits at the intersection of profitability and sustainability. If you’re spending more to acquire customers than those customers are worth over their lifetime, you’re not building a business – you’re funding a leaky bucket. A well-managed acquisition cost, by contrast, signals that your marketing and sales investments are generating real, compounding returns.
Practically speaking, CAC helps you make smarter decisions across the board. It tells you which channels are pulling their weight, where your funnel is losing momentum, and whether your pricing strategy is aligned with your growth ambitions. For eCommerce and SaaS businesses operating in competitive markets – especially in regions like Central and Eastern Europe where cost dynamics differ from Western norms – tracking CAC with precision isn’t optional. It’s the foundation of every scalable, ROI-driven growth strategy you’ll build.
When you monitor acquisition costs consistently, you gain the clarity to optimize spend, justify budget increases to stakeholders, and identify the moments when a channel that once performed well has quietly stopped delivering. That kind of visibility is what separates businesses that scale intentionally from those that grow by accident. With this foundation in place, you’re ready to calculate your actual numbers and see where you stand.
- Growth efficiency signal: CAC reveals how effectively your marketing and sales investments are converting prospects into paying customers.
- Profitability indicator: Comparing CAC against customer lifetime value shows whether your acquisition spending is generating sustainable returns.
- Channel performance tool: Breaking CAC down by source identifies which acquisition paths are pulling their weight and which are draining budget.
- Budget justification: Consistent CAC tracking gives you the data to defend spend increases to stakeholders and reallocate resources with confidence.
- Strategic early warning: Rising CAC signals funnel deterioration or channel saturation before it becomes a cash flow problem.
CAC formula and how to calculate acquisition cost per customer
The standard formula for calculating your acquisition cost per customer is straightforward: divide your total sales and marketing expenditure over a given period by the number of new customers acquired during that same window.
CAC = (Total Sales Costs + Total Marketing Costs) + Number of New Customers Acquired
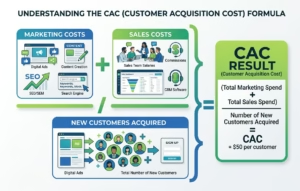
To make this concrete: if your business invests $50,000 in combined sales and marketing during a quarter and brings in 100 new customers, your CAC for that period is $500 per customer. That single number becomes a benchmark you can track, compare against industry standards, and work to improve systematically.
The power of this calculation lies in its consistency. Whether you’re running it monthly, quarterly, or annually, the key is aligning your measurement period with your typical sales cycle. A business with a 90-day average sales cycle will get misleading results from monthly CAC snapshots, because customers acquired in month three were likely influenced by spending from months one and two. Matching the tracking window to the sales cycle gives you an accurate picture of what is actually driving conversions.
It’s also worth being precise about what the formula measures: the cost of acquiring genuinely new customers. Revenue from repeat purchases, upsells to existing accounts, or reactivated lapsed users should not factor into this calculation. Keeping that boundary clear ensures your CAC reflects the true cost of expanding your customer base, not the blended economics of your entire revenue operation.
Once you have a reliable CAC figure, break it down by channel – paid search, organic, social, referral, outbound sales – to understand which acquisition paths are most efficient. That channel-level visibility is where the real optimization opportunities live. But before you can trust those numbers, you need to make sure you’re capturing all the costs that contribute to acquisition.
How to calculate your CAC accurately
- Define your measurement period and align it with your typical sales cycle length.
- Sum all marketing costs for the period: ad spend, content production, email platforms, agency fees, and SEO investments.
- Sum all sales costs for the period: salaries, commissions, bonuses, CRM subscriptions, and sales enablement tools.
- Add a proportional share of overhead tied to sales and marketing functions.
- Count only genuinely new customers acquired during the same period – exclude repeat buyers, upsells, and reactivated accounts.
- Divide total costs by new customers acquired to produce your CAC figure.
- Break the result down by channel to identify which acquisition paths are most efficient.
Essential costs to include in your CAC calculation
One of the most common mistakes businesses make is underestimating their true acquisition cost by leaving out expenses that genuinely contribute to winning new customers. A complete and accurate calculation needs to capture costs across several categories.
- Digital advertising spend: Paid search, social media, display, and programmatic campaigns are the most visible acquisition expenses and must be included in full.
- Content and creative production: Email marketing platform fees, content production costs, SEO investments, and agency or freelancer fees tied to campaign execution all contribute to acquisition.
- Sales team compensation: Salaries, commissions, bonuses, and performance incentives for your sales team all contribute directly to customer acquisition.
- Sales technology stack: CRM subscriptions, sales enablement platforms, prospecting software, and communication tools used by the sales team belong in the calculation.
- Events and promotional costs: Trade show attendance, industry event sponsorships, and promotional offers used to close deals should be factored in.
- Proportional overhead: Office space, equipment, and management time allocated to sales and marketing functions should be included for a fully loaded CAC figure.
This level of precision matters most when comparing performance across channels or making budget allocation decisions, because an artificially low CAC can lead you to over-invest in channels that look efficient on the surface but carry hidden costs underneath. With all costs accounted for, the next step is understanding which version of CAC you should be tracking for different strategic purposes.
Blended CAC versus new customer CAC
These two variations of the same metric serve different strategic purposes, and knowing when to use each one will sharpen your decision-making considerably.
| Metric | What it measures | Best used for | Key limitation |
|---|---|---|---|
| New customer CAC | Cost of acquiring first-time buyers exclusively | Channel efficiency evaluation, growth strategy benchmarking, testing new acquisition strategies | Does not reflect the economics of reactivation or win-back programs |
| Blended CAC | Cost across net-new customers and reactivated or returning leads | Overall program performance reviews and budget reporting | Can obscure true new market penetration costs, producing a misleadingly optimistic picture |
Track both, but weight your strategic decisions toward new customer CAC. Use blended CAC for overall program performance reviews and budget reporting. Use new customer CAC when evaluating channel efficiency, testing new acquisition strategies, or benchmarking against industry standards. This distinction becomes especially important in CEE markets, where reactivation campaigns often play a larger role in revenue mix than in more mature Western markets. Now that you understand how to calculate and categorize your CAC, let’s see how your numbers compare to what other businesses are experiencing across different industries.
Average CAC benchmarks across industries and business models
Knowing your own CAC is only half the equation. The other half is understanding what a reasonable number looks like for your industry and business model. Average acquisition costs vary dramatically across sectors, and what is considered efficient in one vertical can signal serious trouble in another.
| Industry | Business Model | Average CAC |
|---|---|---|
| Legal services | B2B | $1,150–$1,300 |
| Higher education | B2B/B2C | ~$1,100 |
| Commercial insurance | B2B | $900+ |
| B2B SaaS | B2B | ~$702 |
| Jewelry | B2C | ~$91 |
| Electronics retail | B2C | ~$76 |
| Fashion and apparel | B2C | ~$66 |
| Beauty and body treatment | B2C | ~$61 |
| Food and beverage | B2C | ~$53 |
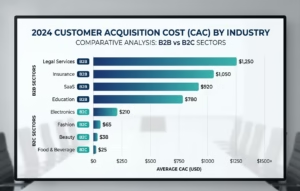
B2B businesses consistently face higher acquisition costs than their B2C counterparts, and for good reason. Longer sales cycles, multiple decision-makers, complex buyer journeys, and higher-touch sales processes all drive up the investment required to close each deal. Among B2B sectors, legal services report some of the highest figures, ranging from $1,150 to $1,300 per customer. Higher education institutions face costs around $1,100, and commercial insurance companies exceed $900 per customer. B2B SaaS companies typically spend approximately $702 per customer, though this varies significantly based on product complexity and target market segment.
B2C businesses operate in a fundamentally different cost environment. Food and beverage brands report an average customer acquisition cost of approximately $53, while beauty and body treatment companies spend around $61 per customer. Fashion and apparel businesses typically invest $66, electronics retailers approximately $76, and jewelry brands around $91 per customer acquired. These lower figures reflect shorter purchase cycles, broader addressable audiences, and the ability to leverage high-volume, lower-cost digital advertising channels effectively.
So what is a good CAC? The answer depends almost entirely on the relationship between your acquisition cost and your customer lifetime value. The widely accepted benchmark is an LTV to CAC ratio of at least 3:1 – meaning you should generate three dollars in customer value for every dollar spent on acquisition. A ratio below 1:1 means you’re losing money on every customer you bring in, which is unsustainable regardless of how fast you’re growing. Ratios between 2.1 and 6 represent acceptable performance across most industries, though the optimal target shifts based on your business model, growth stage, and margin structure.
Industry benchmarks are starting points, not ceilings. Businesses with strong retention, high average order values, or premium pricing can justify higher acquisition costs because the long-term economics support the upfront investment. The benchmark only becomes a problem when your CAC outpaces the value your customers actually deliver. For subscription-based businesses, these dynamics play out differently – which is why they deserve their own analysis.
Subscriber acquisition cost for SaaS and subscription businesses
For subscription-based businesses, the acquisition cost calculation carries additional nuance because the revenue model is fundamentally different. Rather than evaluating a one-time purchase, you’re assessing the cost of acquiring a customer who will generate recurring revenue over months or years – and that changes both how you interpret the numbers and what thresholds make strategic sense.
| Segment | Average Subscriber Acquisition Cost | Notes |
|---|---|---|
| General SaaS | ~$702 | Broad market average across B2B and B2C SaaS |
| eCommerce SaaS | ~$274 | Shorter sales cycles and more self-serve purchasing behavior |
| B2B SaaS (enterprise) | $1,200–$2,000 | Complex enterprise sales cycles drive higher costs |
What makes the subscription model distinctive is that higher upfront acquisition costs can be entirely justified by predictable recurring revenue. A SaaS company spending $1,500 to acquire a customer paying $100 per month achieves full payback within 15 months – after which every additional month of retention is pure margin expansion. This dynamic means subscription businesses can and often should invest more aggressively in acquisition than one-time purchase businesses, provided their retention metrics support the economics.
One important precision point: when calculating subscriber acquisition cost, focus exclusively on customers who complete the transition to paid status. Free-tier users, trial participants who never convert, and freemium accounts that remain permanently unpaid should not be counted as acquired customers. Mixing these groups into your denominator will artificially deflate your CAC and give you a false sense of acquisition efficiency. These global benchmarks provide useful context, but if you’re operating in Central and Eastern Europe, your cost structure likely looks quite different.
Customer acquisition cost benchmarks for CEE markets
Central and Eastern Europe presents a genuinely distinct acquisition cost environment – one that offers real advantages for businesses that understand how to leverage it, but also carries specific challenges that can catch unprepared operators off guard. Indeed, the region has cemented its position as the fastest-growing eCommerce region on the continent.
Digital advertising costs in CEE markets generally run 30–50% below Western European equivalents, and this gap flows directly into acquisition cost calculations. Facebook and Google advertising in Poland, for instance, delivers cost-per-click rates significantly lower than equivalent campaigns in Germany or France, while maintaining comparable conversion rates for properly localized campaigns. This cost advantage extends beyond media buying to sales personnel compensation, CRM platform subscriptions at regional pricing tiers, and content production expenses – creating a compounding effect that meaningfully lowers the total cost of acquiring each customer.
| Segment | CEE Average CAC | Western / Global Benchmark |
|---|---|---|
| B2B SaaS | $400–$900 | $1,200–$2,000 (Western); ~$702 (global average) |
| eCommerce brands | $35–$75 | $53–$91 (established markets) |
Country-level variation within CEE is significant. Poland, Czech Republic, and Hungary generally show lower acquisition costs due to reduced advertising competition and more developed digital infrastructure. Romania and Bulgaria offer even lower media costs but come with less mature programmatic ecosystems and lower average order values in many categories, which affects the overall acquisition economics. For example, entrepreneurs looking to start an eCommerce business in Croatia will find a promising digital marketplace with its own unique dynamics. Businesses entering CEE markets should build country-specific CAC benchmarks rather than treating the region as a monolith – the differences between individual markets can be as large as the differences between CEE and Western Europe overall. For those looking to enter new markets in CEE and the Balkans, understanding these nuances is crucial. Understanding these cost advantages is only part of the story; you also need to account for the structural factors that shape how acquisition works in the region.
Regional factors influencing CAC in CEE countries
Several structural characteristics of CEE markets shape acquisition costs in ways that aren’t immediately obvious from headline advertising rate comparisons.
- Language fragmentation: CEE businesses must invest in fully localized content across Polish, Czech, Hungarian, Romanian, and other languages, which increases creative production costs but simultaneously reduces competition from international brands lacking the resources to execute culturally relevant campaigns.
- Payment infrastructure maturity: Markets with well-established digital payment systems – Poland being the clearest example – experience higher checkout completion rates, reducing the effective cost per converted customer. Where cash-on-delivery remains prevalent, additional conversion friction elevates overall acquisition expenses despite lower media costs.
- Digital advertising maturity: Poland and Czech Republic have more developed programmatic ecosystems with better audience targeting capabilities, improving campaign efficiency. Less mature markets like Bulgaria or parts of the Balkans may see lower media costs partially offset by less precise targeting and lower baseline conversion rates.
- Advertising competition levels: Reduced competition from international brands in local-language environments keeps cost-per-click rates lower, creating a defensible cost advantage for businesses committed to genuine localization.
Businesses entering less mature markets like Bulgaria or certain parts of the Balkans may find that lower media costs are partially offset by less precise targeting and lower baseline conversion rates, requiring more investment in funnel optimization to achieve comparable acquisition efficiency. This highlights the importance of scaling eCommerce across the Balkans & CEE with tailored cross-border growth and localization strategies. With these regional dynamics in mind, let’s look at the broader set of metrics you should be tracking alongside your core CAC figure.
CAC metrics and performance indicators to track
CAC on its own tells you what you’re spending to acquire customers. The metrics surrounding it tell you whether that spending is working, how long it takes to pay off, and whether the customers you’re acquiring are actually worth what you paid for them. Building a complete measurement framework means tracking several interconnected indicators alongside your core acquisition cost figure.
- Channel-level CAC: Breaking down acquisition costs by source – paid search, organic, social media, referral programs, outbound sales, partnerships – reveals which channels are delivering the most cost-efficient customers and which are quietly draining budget.
- Cost per lead: Tracks top-of-funnel spending efficiency and provides an early signal of rising acquisition costs before they reach the final CAC figure.
- Lead-to-qualified-lead conversion rate: Measures how effectively your funnel is filtering prospects into genuine opportunities, helping isolate whether CAC increases stem from targeting or qualification issues.
- Qualified-lead-to-customer conversion rate: Captures the efficiency of your sales process in closing deals, directly influencing your final acquisition cost.
- Country-level CAC (CEE-specific): For businesses operating across CEE markets, tracking CAC by country reveals optimization opportunities that are invisible in blended regional figures.
For businesses operating in CEE markets specifically, tracking CAC by country adds another layer of strategic visibility. The cost dynamics in Poland differ meaningfully from those in Romania or Hungary, and treating the region as a single market in your reporting will mask optimization opportunities that only become visible at the country level. Two metrics in particular deserve deeper attention because they directly determine whether your acquisition economics are sustainable.
CAC payback period and its significance
What is CAC payback period?
The CAC payback period answers a question that’s critical for cash flow management: how long does it take to earn back what you spent to acquire a customer? Calculate it by dividing your CAC by the monthly revenue – or gross profit, for a more conservative measure – that customer generates.
For SaaS companies, typical payback periods range from 12 to 18 months, though this varies considerably based on pricing models and customer retention rates. Organizations generating over $20 million in annual recurring revenue often experience longer payback periods, reflecting the increased investment in sales and marketing infrastructure required to reach enterprise clients and maintain competitive positioning at scale.
A company spending $1,500 to acquire a customer paying $100 per month achieves payback within 15 months. After that point, the relationship becomes increasingly profitable with each passing month. The strategic implication is clear: businesses with strong retention can afford longer payback periods because the long-term economics justify the wait. Businesses with high churn, however, need much shorter payback windows – ideally under 12 months – to ensure they’re recovering acquisition costs before customers leave.
In CEE markets, where acquisition costs are generally lower, payback periods tend to be shorter for equivalent products and pricing. This is one of the structural advantages of building or expanding in the region, particularly for subscription businesses that benefit from the combination of lower acquisition costs and growing digital adoption rates across the territory. Payback period tells you when you break even; the LTV to CAC ratio tells you whether the relationship is worth pursuing in the first place.
Customer lifetime value to CAC ratio
What is a good LTV to CAC ratio?
If there’s one ratio that captures the fundamental health of your acquisition strategy, it’s the relationship between customer lifetime value and CAC. This metric tells you how much value you’re generating relative to what you’re spending to create that value – and it’s the clearest signal of whether your growth model is sustainable.
| LTV:CAC Ratio | What it signals | Recommended action |
|---|---|---|
| Below 1:1 | Spending more to acquire customers than they will ever return | Urgent restructuring of acquisition economics required |
| 1:1 to 2:1 | Marginal returns; acquisition costs are too high relative to value | Reduce CAC or improve retention and average order value |
| 3:1 to 4:1 | Healthy, sustainable acquisition economics | Maintain current strategy; optimize incrementally |
| 2.1 to 6:1 | Acceptable performance range across most industries | Optimize toward the higher end based on growth stage |
| Above 6:1 | Strong unit economics but likely underinvestment in growth | Increase acquisition spend to capture market share |
The widely accepted minimum benchmark is a 3:1 LTV to CAC ratio. For every dollar you invest in acquiring a customer, you should generate at least three dollars in lifetime value. Ratios between 3:1 and 4:1 indicate healthy, sustainable acquisition economics across most industries. Performance in the 2.1 to 6 range is generally considered acceptable, with the optimal target depending on your business model, growth stage, and competitive environment.
A ratio below 1:1 is a clear warning signal – you’re spending more to acquire customers than those customers will ever return, which is a structural problem that no amount of revenue growth will solve without addressing the underlying economics. On the other end, a ratio exceeding 6:1 often indicates underinvestment in growth. If your customers are generating six times what you spend to acquire them, you likely have room to invest more aggressively in acquisition and capture market share before competitors do.
For CEE-focused businesses, this ratio often looks favorable due to lower acquisition costs, but it’s important to calculate LTV accurately for regional customer bases. Average order values, purchase frequency, and customer lifespan can differ from global benchmarks, so applying Western LTV assumptions against CEE CAC figures will produce an inflated ratio that doesn’t reflect the true economics of your regional operation. With a clear picture of where you stand, you’re ready to start improving those numbers systematically.
Proven strategies to reduce acquisition cost per customer
Lowering your acquisition cost per customer isn’t about cutting marketing budgets – it’s about getting more conversions from the investment you’re already making. The businesses that consistently achieve below-benchmark CAC do so by optimizing conversion efficiency, sharpening their targeting, and building acquisition channels that compound over time.
- Conversion rate optimization: Small improvements to landing pages, checkout flows, or trial sign-up processes can dramatically reduce your effective acquisition cost without increasing spend. A/B testing headlines, call-to-action buttons, pricing displays, and form fields helps identify which elements move prospects through the funnel most efficiently. For eCommerce brands, simplifying the checkout experience can boost conversion rates by up to 35% (Baymard Institute), directly lowering the effective cost per acquired customer.
- Audience targeting refinement: Highly segmented campaigns based on behavioral signals, demographic data, and purchase intent reduce wasted spend by concentrating resources on users most likely to convert, delivering compounding returns over time.
- Retargeting campaigns: Visitors who already know your brand convert at 2–3 times the rate of cold traffic, making retargeting one of the most cost-efficient tools in your acquisition arsenal through email sequences, display advertising, or social media remarketing.
- Marketing automation: Automated email sequences, lead-nurturing workflows, and behavior-triggered messaging move prospects toward conversion without requiring additional team bandwidth, effectively lowering the labor cost component of your CAC.
- Referral programs: Customers acquired through referrals typically demonstrate 13–35% lower acquisition costs and higher lifetime value compared to customers from paid channels, making referral infrastructure one of the best long-term investments in your acquisition economics.
- Content localization and organic search (CEE-specific): Investing in genuine content localization and building organic search presence in local languages creates acquisition channels that become progressively cheaper over time, reducing your blended CAC quarter over quarter as digital advertising costs rise with increased competition.
Frequently Asked Questions
- What is a simple definition of customer acquisition cost? Customer acquisition cost is the total amount your business spends – across marketing, sales, tools, and related operations – to convert a prospect into a paying customer. It’s calculated by dividing total sales and marketing expenses by the number of new customers acquired during the same period.
- Which expenses should I include when calculating CAC? Include all direct marketing costs (ad spend, content production, email platforms), sales team compensation (salaries, commissions, bonuses), technology tools (CRM, analytics, sales enablement software), agency fees, event costs, and a proportional share of overhead tied to sales and marketing functions. Leaving out any of these will understate your true acquisition cost.
- What is the difference between blended CAC and new customer CAC? New customer CAC measures the cost of acquiring first-time buyers only, giving you a pure signal of market expansion efficiency. Blended CAC includes costs associated with reactivated or returning customers as well. Use new customer CAC for channel benchmarking and growth strategy decisions; use blended CAC for overall program performance reviews.
- What is a good LTV to CAC ratio? The widely accepted benchmark is 3:1 – three dollars of customer lifetime value for every dollar spent on acquisition. Ratios between 3:1 and 4:1 indicate healthy economics. Below 1:1 signals unsustainable spending; above 6:1 often suggests you’re underinvesting in growth and leaving market share on the table.
- How do CAC benchmarks in CEE compare to Western European markets? CEE markets generally offer 30–50% lower digital advertising costs than Western Europe, which flows directly into lower acquisition costs. B2B SaaS companies in CEE typically spend $400–$900 per customer versus $1,200–$2,000 in mature Western markets. eCommerce brands report $35–$75 per customer in CEE compared to $53–$91 in established markets.
- What is a typical CAC payback period for SaaS companies? Most SaaS companies target a payback period of 12 to 18 months. Companies generating over $20 million in annual recurring revenue often see longer payback periods due to higher infrastructure investment. In CEE markets, lower acquisition costs tend to shorten payback periods for equivalent products and pricing structures.
- How does subscriber acquisition cost differ from standard CAC? Subscriber acquisition cost applies the standard CAC formula specifically to subscription businesses, focusing on customers who complete the transition to paid status. It excludes free-tier users and unconverted trial participants. The metric is evaluated against recurring revenue streams rather than one-time purchase value, which changes the acceptable cost thresholds significantly.
- What are the most effective ways to reduce acquisition cost per customer? The highest-impact tactics are conversion rate optimization (improving landing pages, checkout flows, and sign-up processes), audience targeting refinement (behavioral and intent-based segmentation), retargeting campaigns (which convert at 2–3 times the rate of cold traffic), marketing automation (reducing manual labor costs), and referral programs (which typically deliver 13–35% lower CAC than paid channels).
- Which tools should I use to track CAC and related metrics? CRM platforms like HubSpot or Salesforce provide the foundation for tracking sales costs and customer counts. Google Analytics and paid media dashboards (Google Ads, Meta Ads Manager) capture channel-level spending and conversion data. For subscription businesses, tools like ChartMogul or Baremetrics calculate CAC payback periods and LTV ratios automatically from your billing data.
- How often should I recalculate my CAC? Calculate CAC at minimum quarterly, aligning the measurement period with your typical sales cycle length. Monthly tracking is valuable for fast-moving eCommerce businesses with short purchase cycles. For B2B companies with longer sales cycles, quarterly or semi-annual calculations provide more accurate results. Always track CAC by channel alongside your blended figure to maintain actionable visibility into what is actually driving your acquisition economics.
References
- FirstPageSage – Customer Acquisition Cost by Industry (2024). Primary source for CAC benchmarks: Legal $1,150–$1,300, Higher Ed ~$1,100, B2B SaaS ~$702, Jewelry ~$91, Electronics ~$76, Fashion ~$66, Beauty ~$61, Food & Beverage ~$53.
- Shopify – How To Calculate Customer Lifetime Value (2025). Source for LTV:CAC benchmark of 3:1.
- Stripe – SaaS Metrics Guide. Source for SaaS CAC payback period benchmark of 12–18 months.
- MarketingLTB – Retargeting Statistics 2025. Retargeting campaigns deliver 2–4x higher conversion rates vs. cold traffic.
- Talkable – Referral Program Statistics. Referred customers demonstrate 13–35% lower CAC compared to paid channels.
- eCommerce Europe – European eCommerce Report 2025. Context for CEE as fastest-growing ecommerce region and digital ad cost differentials.
- Baymard Institute – Cart Abandonment Rate Statistics. Large eCommerce sites can gain up to 35.26% increase in conversion rate through checkout optimization.